POLYLINE
Start from API_LEVEL
2.0. Please refer to API_LEVEL.
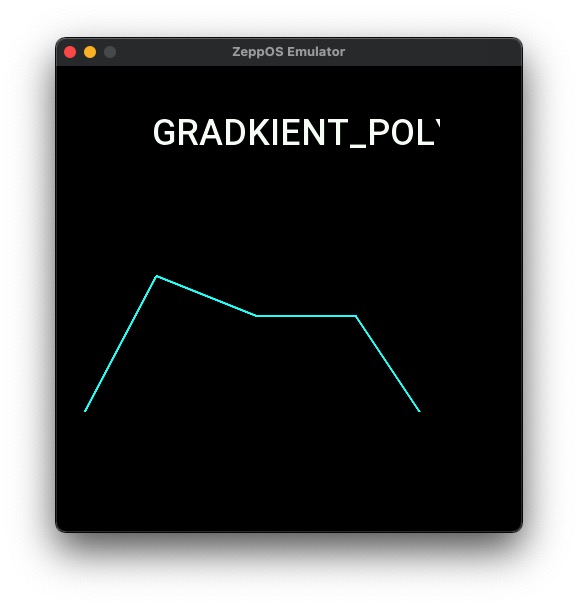
Draws polylines that can be done on a line graph with multiple segments.
Create UI widget
const polyline = hmUI.createWidget(hmUI.widget.GRADKIENT_POLYLINE, Param)
Type
Param: object
| Properties | Description | Required | Type |
|---|---|---|---|
| x | The x-coordinate of component. | YES | number |
| y | The y-coordinate of component. | YES | number |
| w | The width of component. | YES | number |
| h | The height of the component. | YES | number |
| line_color | Line color, default 0xe60039 | NO | number |
| line_width | Line width, default 2 px | NO | number |
polyline instance
polyline.clear()
() => void
Clear drawn lines
polyline.addLine()
(option: Option) => void
Option: object
| Properties | Description | Type |
|---|---|---|
| data | Coordinate arrays | Array<AxisItem> |
| count | Coordinate array length | number |
AxisItem: object
| Properties | Description | Type |
|---|---|---|
| x | Horizontal coordinates, relative coordinates, distance from the left side of the widget | number |
| y | Vertical coordinates, relative coordinates, distance from the bottom of the widget | number |
Code example
import { createWidget, widget } from '@zos/ui'
import { px } from '@zos/utils'

Page({
  build() {
    const lineDataList = [
      { x: 0, y: px(200) },
      { x: px(100), y: px(10) },
      { x: px(200), y: px(50) },
      { x: px(300), y: px(50) },
      { x: px(400), y: px(200) }
    ]
    const polyline = createWidget(widget.GRADKIENT_POLYLINE, {
      x: 0,
      y: px(200),
      w: px(480),
      h: px(200),
      line_color: 0x00ffff,
      line_width: 4
    })
    polyline.clear()
    polyline.addLine({
      data: lineDataList,
      count: lineDataList.length
    })
  }
})